Detroit placed No. 96 in WalletHub's latest driving-friendliness study. The city posted especially weak scores for safety, traffic and infrastructure, while drivers nationwide lose nearly 370 hours each year to the road.
WalletHub used 30 measures to compare driving conditions in the 100 largest U.S. cities. The measures covered gas prices, congestion, crash risk and road conditions.
Detroit finished No. 96. Only four cities ranked lower.
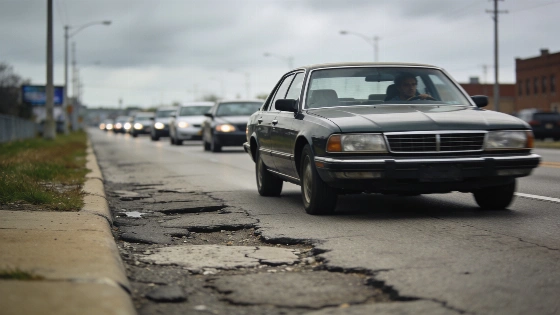
Safety was Detroit's weakest category. The city finished last there. It also scored poorly for the cost of owning and maintaining a vehicle, as well as for traffic and infrastructure. Drivers face a difficult mix of risk, delay and expense.
The ranking is a comparison of conditions at the time of the study. It is not a current city safety assessment. It also does not show that Detroit has formally changed its position. Available reporting confirms the original No. 96 placement and last-place safety result. It does not show an official WalletHub revision.
Only New York, Los Angeles, Washington, D.C., and Philadelphia ranked lower than Detroit. That puts the Michigan city in the bottom five among the largest cities examined. It is more than a result below the national average.
WalletHub analyst Chip Lupo said the strongest cities keep down the cost of owning and maintaining a car. They also limit commute times, congestion and crashes while keeping roads in good condition. Detroit performed poorly across those practical measures. Safety produced the city's lowest score.
Local crime data offer newer context. According to the Detroit Police Department, Detroit recorded 165 criminal homicides in 2025. Police classified 17 of those cases as justifiable. It was the first annual total below 200 homicides in roughly six decades.
Police data showed a 26% decline in nonfatal shootings in 2025, from 607 to 447. Carjackings fell 46%, from 142 to 77. Overall violent crime fell 10.2%. Property crime declined 9.7%.
Those numbers do not erase the safety concerns in WalletHub's study. They show why a fixed national ranking and newer local crime data can describe different parts of Detroit's transportation and public-safety environment.
The summer numbers moved in the same direction. From June through August 2026, homicides in Detroit declined 25% compared with the same period in 2025. Carjackings fell 34.6%. Vehicle thefts dropped 17.2%, and nonfatal shootings decreased 9.4%.
Mayor Mary Sheffield described the city as much safer than in previous years. Police Chief Todd Bettison said most crime categories declined during the summer. Sexual assaults rose 5.8%. Broad declines do not mean every safety problem has ended.
Traffic is costly across the country. The study found that drivers spend nearly 370 hours on the road each year. That equals more than 15 full days behind the wheel. The figure does not include extra time lost when traffic slows or stops.
Congestion also affects household budgets. WalletHub estimated that wasted time and extra fuel use add up to roughly $894 per driver each year. Drivers feel the delay one trip at a time, but the costs also show up through lost time and higher fuel use.
City comparisons show how widely driving conditions differ. Irvine, California, had the lowest traffic fatality rate per 100,000 residents. Its rate was 11.8 times lower than Memphis, Tennessee, which had the highest rate.
Fort Wayne, Indiana, had the lowest average gas price. San Francisco had the highest. Its average price was 1.7 times Fort Wayne's level.
Parking and congestion showed similarly wide gaps. Corpus Christi, Texas, had the lowest average parking rate. The rate was 33.4 times lower than San Diego's. Lubbock, Texas, had the fewest annual hours spent in congestion per auto commuter. Chicago had the most, with congestion hours 14 times higher than Lubbock's.
Gas prices tell only part of the story. A city may be inexpensive at the pump and still cost drivers more through parking, delays, unsafe roads or vehicle maintenance. That wider calculation put Detroit at No. 96.
For families in and around Farmington, school transportation is part of the safety picture. State of Michigan data show nearly 1,200 crashes involving school buses statewide in 2025. Three of those crashes were fatal.
Of the reported incidents, 434 occurred between 6 and 9 a.m. Another 544 occurred between 2 and 5 p.m. Those are the periods when many students travel to or from school. The figures cover the entire state. They cannot be used to calculate a Detroit-specific or Farmington-specific crash rate.
The local connection includes the Farmington Public Schools board, the City of Farmington and the City of Farmington Hills. These bodies oversee or coordinate community systems affected by daily traffic, school travel and pedestrian safety.
Oakland County administration and State of Michigan transportation and public-safety agencies provide wider regional data and programs. Their statistics should not be combined with WalletHub's city-ranking method.
Another Farmington Voice report examined a different infrastructure network. Its statewide data-center review looked at data centers across Michigan. WalletHub's study looked at the roads and services people use to move through cities.
WalletHub's ranking is a comparison, not a Detroit action plan. The available material does not identify a specific Detroit road project or policy change tied to the result.
It does provide a clear snapshot of Detroit's performance against other large cities on cost, traffic, infrastructure and safety at the time of the study. That snapshot has limits.
For Detroit drivers, the main issue is the combination behind the ranking. Safety finished last. Infrastructure and traffic also produced weak results.
Newer declines in homicides, shootings, carjackings and vehicle thefts add context. The 5.8% increase in sexual assaults and the statewide school-bus crash figures point to continuing risks. Safer roads and more reliable travel conditions still require public attention.