
Visual & Interactive Stories
1 storyFor readers following Visual & Interactive Stories, the editorial focus is interactive maps, where project maps and explainer diagrams often converge. The reporting is framed for readers who need deeper explanation or evidence. This page is organized around visual and interactive storytelling methods, not a subject beat, and can therefore include maps, graphics and tools from across the newsroom.
Reporting ranges from interactive maps, charts and dashboards, photo and graphic explainers and visual timelines, tied to road closure maps and visual investigations. Visual & Interactive Stories prioritizes documented consequences over speculation.
Reporting ranges from interactive maps, charts and dashboards, photo and graphic explainers and visual timelines, tied to road closure maps and visual investigations. Visual & Interactive Stories prioritizes documented consequences over speculation.
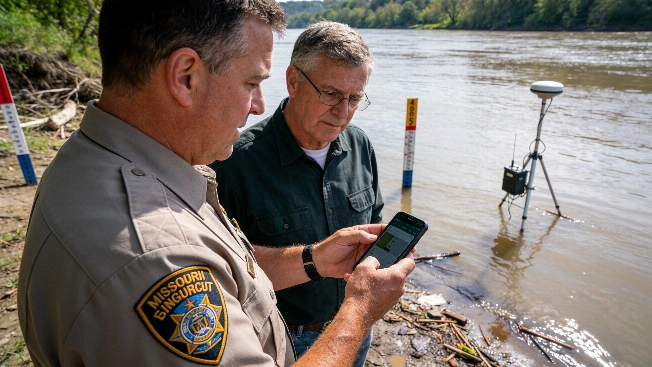
Missouri Unveils Flood and Drought App for Real-Time Updates
Missouri has launched a new mobile app and website to help residents and officials monitor flood and drought risks, offering real-time data, alerts, and predictions statewide. The project is funded by $10.4 million in federal relief.